|
 |
| 1. Introduction |
Status
| MESSAGE TYPE | : INVRPT |
| REFERENCE DIRECTORY | : D.01B |
| EANCOM® SUBSET VERSION | : 007 |
Definition
A message specifying information related to held inventories and planned or targeted inventories. The Inventory Report message is intended to be used in either direction between trading partners.
Principles
The exchanged information will relate to inventories of raw materials, manufactured articles, returnable containers which are GS1 coded and which can be exchanged or returned, or other inventoriable goods.
The information can be exchanged between a manufacturer and a distributor (wholesaler), manufacturer and consignment holder, retailer to wholesaler, headquarters or service provider, etc.
The message includes functionality to differentiate classes of inventory, and to permit financial valuation of inventories.
The specified quantities relating to held product can indicate opening stock, actual stock, quality control held stocks, damaged stock, and goods movement (receipts or withdrawals) of held inventory, for a given time frame.
The specified quantities may also relate to planned or targeted inventories and can indicate model or target stock, minimum stock, maximum stock and reordering point stock levels.
The specified quantities can relate directly to a product or package, and may be sub-detailed within different groups or classes, e.g. batch, location, age, etc.
For every specified quantity it is possible to indicate status information (events which have happened and the reasons for the events), and the relative package identifications of the physical units involved.
Structure of the Inventory Report Message
The EANCOM® Inventory Report message may have two basic structures, a simple and an extended, depending if the stock report covers one stock-holding location or multiple locations.
Specific stock attributes such as batch numbers, production or sell by dates and shipping container information may be provided in both structures.
The tables below summarise the possible functionalities within the simple and extended Inventory Report messages, with the principal segments used in each case.
The functionalities described in the simple and extended Inventory Report tables are not necessarily mutually exclusive. Segments marked as "Not used" are not needed to cover the functionality described but may be needed when combining two or more of the functionalities outlined.
For example, it is possible to have a simple Inventory Report providing the total stock of a product within a location, and dividing the total stock quantity into sub-quantities by production date. Additionally, the serialised pallets carrying the stock may be identified together with a pallet minimum durability date.
Identification of Individual
Shipping Containers
The GS1 Serial Shipping Container
Code
The Serial Shipping Container Code (abbreviated SSCC) is an GS1 standard designed to identify uniquely individual transport packages. It enables merchandise that is packed differently from one transport package to another, for example where products are picked and packed to meet individual orders, to be identified. The standard can support operations such as despatch, distribution and receiving of non-standardised packages.
The general code structure is:
P |
MMMMMMM |
SSSSSSSSS | C | |
1 |
<-------7-------> |
<-----9-----> | 1 |
where
| P | = | Packaging indicator |
| M..M | = | GS1 prefix/company number |
| S..S | = | Serial number assigned by the company |
| C | = | Data check digit |
The Serial Shipping Container Code may be bar coded, enabling automatic data capture, using the Application Identifier 00 and the UCC/EAN-128 bar code symbology. For further information please refer to the UCC/EAN Application Identifier Standard.
Table 1
| SIMPLE INVENTORY REPORT: Stock report covering one location for one or more products. | ||||||
FUNCTIONALITIES: |
PRINCIPAL SEGMENTS USED |
|||||
HEADER SECTION |
DETAIL SECTION |
|||||
NAD |
CUX-DTM |
LIN |
QTY and PRI |
GIN-LOC-DTM-RFF |
CPS-PAC-GIN-DTM |
|
| 1. Total stock per product within location. | Identifies sender and receiver of message. Identifies stock reporting location if different from message sender. Locations identified by GLN. | Not used. | Identifies GTIN. One LIN repetition per product. | Both segments used to indicate the stock quantities and the cost or retail price for the product. | Not used. | Not used. |
| 2. Total stock quantity divided in sub-quantities according to specific attributes, e.g. stock sub-quantity from a specific batch/serial numbers or date. | Identifies sender and receiver of message. Identifies stock reporting location if different from message sender. Locations identified by GLN. | Not used. | Identifies GTIN. | Identifies stock totals for the full attribute, e.g. batch, stock sub-quantity for a specific attribute, and the cost or retail price for the product. | Identifies attribute to stock sub-quantity. GIN specifies batch or serial numbers. DTM specifies dates such as production or best before dates. | Not used. |
| 3. Total stock quantity divided in sub-quantities according to shipping container. | Identifies sender and receiver of message. Identifies stock reporting location if different from message sender. Locations identified by GLN. | Not used. | Identifies GTIN. | Identifies stock totals for the full attribute, e.g. shipping container, provides sub-quantity relevant to a type of shipping container or a specific shipping container, and the cost or retail price for the product. | Not used. | PAC identifies the number and type of shipping container. GIN provides the Serial Shipping Container Code. DTM may be used to provide relevant dates per shipping container. |
Table 2
| EXTENDED INVENTORY REPORT: Stock report covering several locations for one or more products. | ||||||
| FUNCTIONALITIES: | PRINCIPAL SEGMENTS USED | |||||
| HEADER SECTION | DETAIL SECTION | |||||
| NAD | CUX-DTM | LIN | QTY and PRI | GIN-LOC-DTM-RFF | CPS-PAC-GIN-DTM | |
| 1. Total stock per product and per location for several locations. | Identifies sender and receiver of message. Locations identified by GLN. | Not used. | Identifies GTIN. | Identifies the total stock quantity of product identified in LIN for the location identified in LOC, the total stock for the product in all locations, and the retail price for the product. | LOC identifies the location where stock is held. Locations identified by GLN. DTM may identify the stock report date if different than date at header level. | Not used. |
| 2. Total stock quantity divided in sub-quantities per location according to specific attributes, e.g. stock sub-quantity from a specific batch/serial numbers or date. | Identifies sender and receiver of message. Locations identified by GLN. | Not used. | Identifies GTIN. | Identifies the stock sub-quantity for a specific attribute within a location, the total stock for the product in all locations, and the retail price for the product. | LOC identifies the location where stock is held. Locations identified by GLN. Identifies attribute to stock sub-quantity within a location. GIN specifies batch or serial numbers. DTM specifies stock report date and other dates such as production or best before dates. | Not used. |
| 3. Total stock quantity divided in sub-quantities per location according to shipping container. | Identifies sender and receiver of message. Locations identified by GLN. | Not used. | Identifies GTIN. | Identifies the stock sub-quantities per location relevant to a type of shipping container or a specific shipping container, the total stock for the product in all locations, and the retail price of the product. | LOC identifies the location where stock is held. DTM may identify the stock report date if different than date at header level. | PAC identifies the number and type of shipping container. GIN provides the Serial Shipping Container Code. DTM may be used to provide relevant dates per shipping container. |
Quantity Qualifiers Used in the Inventory Report Message
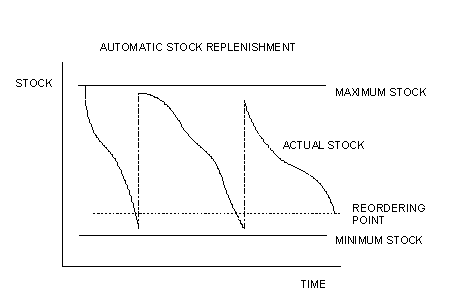
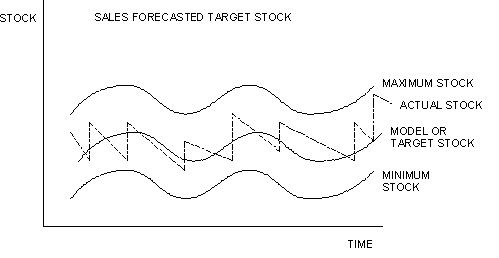
The graphs below provide a simplified illustration of some of the stock quantities which may be provided in the Inventory Report message as part of a stock management control system. This section does not intend to provide a brief overview of stock management systems which are complex and dependent on a large number of other parameters. The aim is to provide a conceptual definition of some of the stock quantity values which may be transmitted in the Inventory Report message.
The Automatic Stock Replenishment graph illustrates a stock management system controlled by a fixed and constant reordering point somewhere in between fixed and constant maximum and minimum stock levels. Product demand/sales forecasts are relatively stable (assume constant) through time.

The difference between the maximum and minimum stock levels is the safety or buffer stock. If inventory falls below the reordering point, an order may be automatically triggered, followed by delivery.
The difference between the reordering point and the minimum stock level is dependent mainly on the delivery lead time, as well as turnover of the product, price of the product, demand/sales variations and other variables. A margin between the reordering point and the minimum stock level will prevent out-of-stock situations.
The difference between the maximum stock level and the reordering point is dependent mainly on the delivery frequency as well as product turnover, demand/sales variations and other variables.
Stock levels may be reduced by minimising the difference between maximum stock level and the reordering point, e.g. within a Just In Time or Quick Response environment the goal is to deliver product on a "as-needed" basis through frequent deliveries thus eliminating safety stock.
The Sales Forecasted Target Stock graph illustrates a stock management system controlled by a variable model or target stock somewhere in between variable maximum and minimum stock levels. The difference between the maximum and minimum stock levels is the buffer of safety stock held. Product demand is variable in this case and actual sales data (SLSRPT) and sales forecast (SLSFCT) information determine the maximum, minimum and optimum or target stock levels.

The goal is to maintain the actual stock level as close as possible to the model or target stock. More frequent deliveries and shorter delivery lead times will allow actual stock levels to match target stock levels more closely.
The reordering point in this case is variable and dependent on the target stock level at any given point in time. The buffer or safety stock can be reduced, i.e. the maximum and minimum stock levels converge closer and closer towards the target stock level, through more accurate sales data and sales forecasting.
Data on actual and target inventories can be used in combination with actual sales data (EANCOM® Sales Data Report - SLSRPT) and sales forecasting data (EANCOM® Sales Forecast - SLSFCT) to maintain stock levels close to the model or target stock level or within an automatic replenishment environment to trigger reordering and delivery.
Accurate inventory and forecasting data will enable manufacturers to better control production requirements and distributors to optimise safety or buffer stock levels taking into account the cost of held inventories and market response.
|